Who is this course for?
This course is most relevant and targeted at folks who work with data, from analysts and program staff to engineers and scientists. This course provides an introduction to the power and possibility of a reproducible programming language (R) by demonstrating how to import, explore, visualize, analyze, and communicate different types of data. Using water resources based examples, this course guides participants through basic data science skills and strategies for continued learning and use of R.
Why R?
R is a language for statistical computing and a general purpose programming language. It is one of the primary languages used for data science, modeling, and visualization.
This workshop will provide attendees with a starting point for continued learning and use of R. We will cover a variety of commonly used file types (i.e., .csv, .xlsx, .shp) used in analysis, and provide resources for additional learning.
What will you learn?
In this course, we start from first principles and assume no prior experience with R. Although each module in this course can serve as a “stand-alone” lesson, we recommend completing modules in order from start to finish.
In this course you will gain practice in:
- Data and file management: understanding RProjects and file paths
- Understand and identifying different data formats (i.e., wide, long, tidy)
- Working with different data structures (i.e., vectors, dataframes, lists)
- Importing and exporting various water resources data
- Strategies for Exploratory Data Analysis (EDA)
- Strategies for troubleshooting (reading documentation, intro to reprex)
- Transforming data with
{dplyr} - Data visualization with
{ggplot2} - Data presentation and communication with RMarkdown

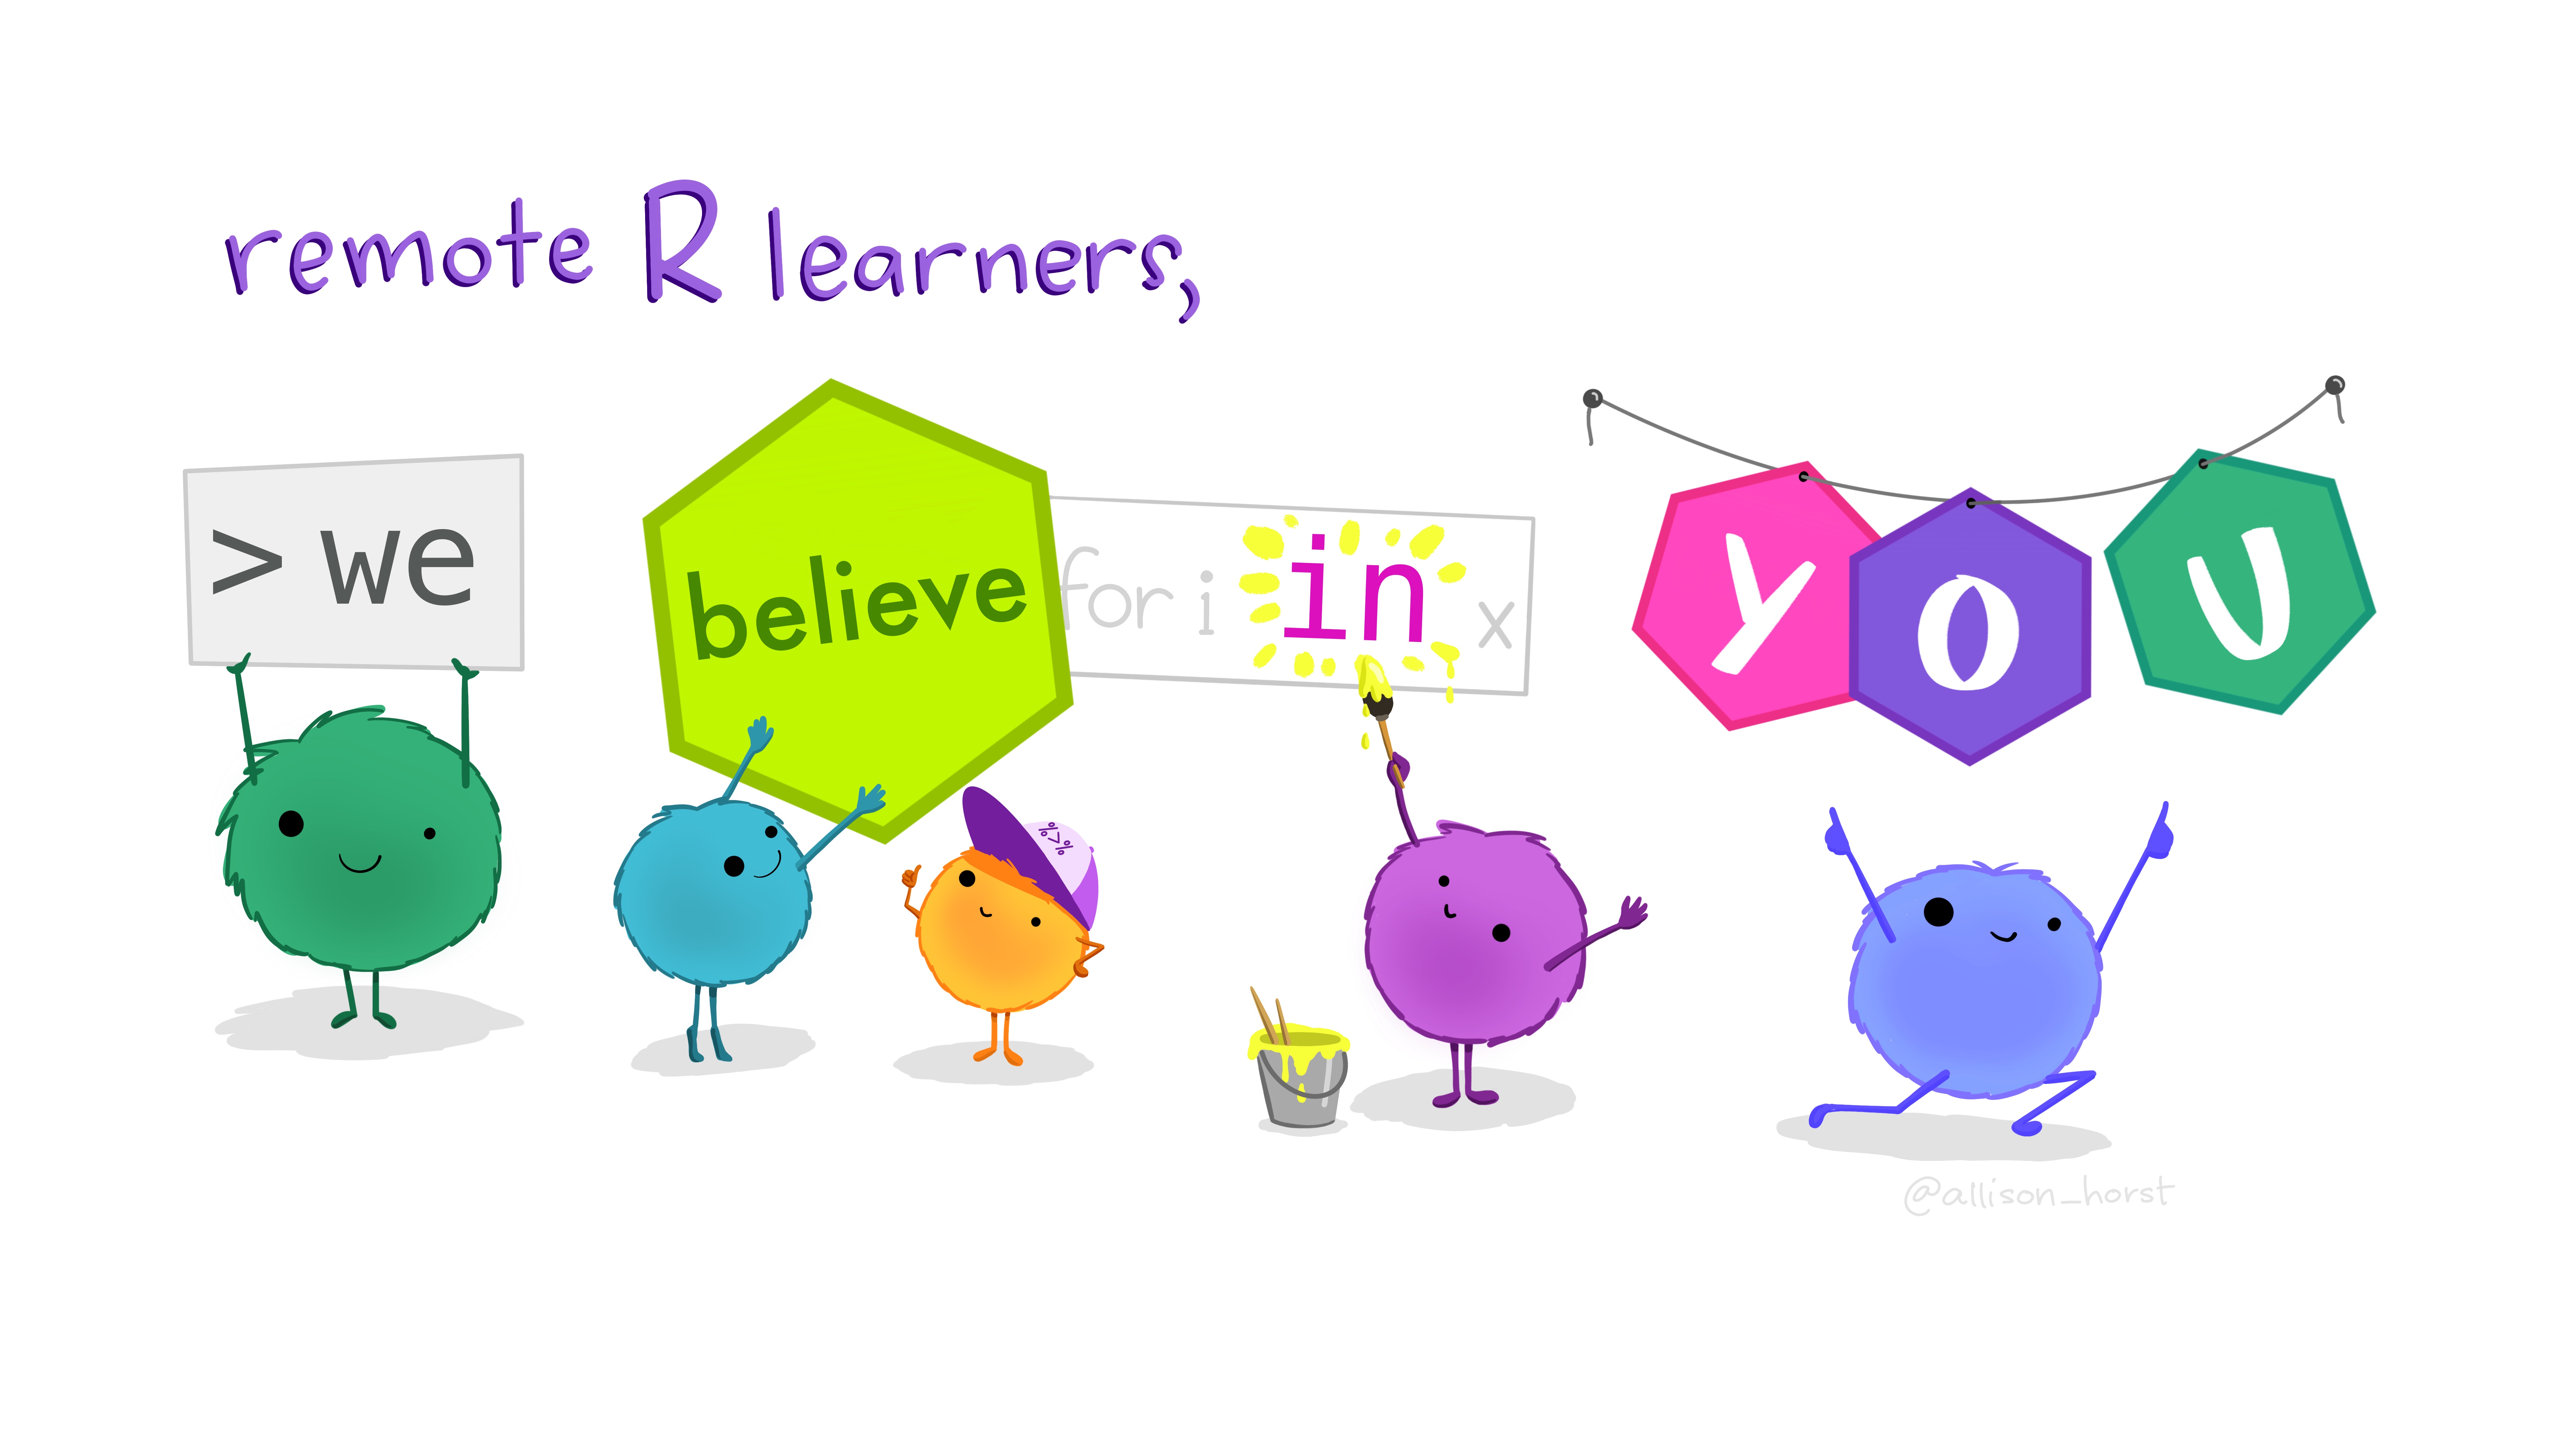
Figure 1: Artwork by @allison_horst
Course Modules
- Install R and RStudio
- Get oriented in RStudio
- Practice data and file management: understand RProjects and file paths
- Import and export various water resources data
- Visualize data with {
ggplot2}
- Understand and identify different data structures (i.e., vectors, dataframes, lists)
- Transform data with {
dplyr}
- Discuss spreadsheets and pivots
- Learn how to write custom functions
- Join different datasets together
- Use spatial data to create static and interactive maps
- Explore strategies for Exploratory Data Analysis (EDA)
- Practice data presentation and communication with {
RMarkdown}
- Explore strategies for troubleshooting (reading documentation, intro to reprex)
Data
All data used in this course is expected to live in a /data subfolder in the project directory. It can be downloaded in 1 of 2 ways:
- Download combined Rproj and dataset from the
r4wrds-dataGithub repository - Download data-only from OSF
Your project directory structure should look like this (note the position of the /data subfolder):
.
├── scripts
│   ├── module_01.R
│   └── module_02.R
│   └── ...
├── data
│   ├── gwl.csv
│   └── polygon.shp
│   └── ...
└── intro_proj.Rproj
To complete code exercises and follow along in the course, we will create these folders and download the data in the introductory project management module.
Workshop Overview
We will follow the SFS Code of Conduct throughout our workshop.
Source content
All source materials for this website can be accessed at the r4wrds Github repository.
Attribution
Content in these lessons has been modified and/or adapted from Data Carpentry: R for data analysis and visualization of Ecological Data, the USGS-R training curriculum here, the NCEAS Open Science for Synthesis workshop here, Mapping in R, and the wonderful text R for data science.
Next module:
1. Install R/RStudio
site last updated: 2024-01-20 20:55